

Blog
Automatic chicken feeding system reduces feed distribution deviation across cage tiers in Ethiopian poultry farms.
This article explains H type cage structural efficiency under intensive production conditions.
It evaluates how feeding consistency affects feed conversion and egg output.
It analyzes labor substitution effects under Ethiopian wage and workforce constraints.
It discusses energy instability and hybrid power adaptation strategies.
It provides feed compatibility insights using locally available raw materials.
It concludes with scalable investment and operational optimization strategies.
Get professional poultry farm construction guidance, equipment selection solutions, and the latest price lists, whatsApp to +8618830120193, click to learn more:

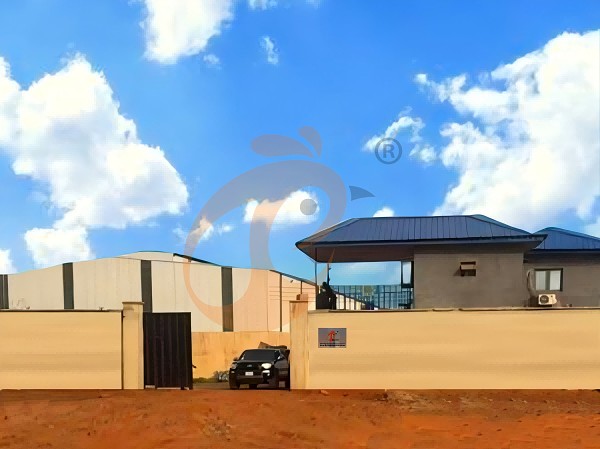
Ethiopia Branch Office And Factory Of Poultry Farm Equipment
Frequently Asked Questions
Q1: Is H type chicken cage suitable for Ethiopian climate conditions?
The system performs effectively when ventilation and shading are adapted to regional temperature and humidity conditions.
In hotter regions such as Afar and Somali, airflow enhancement and reduced stocking density per cage tier improve performance stability.
Q2: Can automatic feeding systems work with local feed materials in Ethiopia?
Yes, but feed particle size must be controlled to prevent flow interruption in feeding lines.
Preprocessing through consistent grinding and moisture adjustment improves compatibility with automated equipment and reduces blockage risk.
Q3: Is the investment affordable for small Ethiopian farmers?
Initial cost barriers can be managed through phased system installation and cooperative financing models.
Access to agricultural loans, shared infrastructure, and gradual scaling reduces financial pressure and maintains productivity.
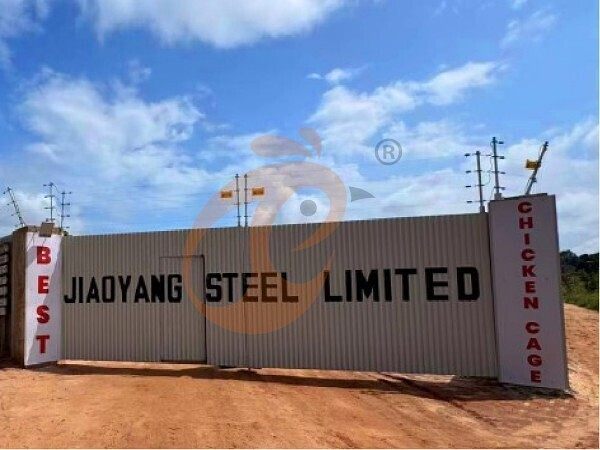
Ethiopia Best Hebei Machinery Manufacturing Plc - One Of Ethiopia Largest Chicken Cage Manufacturer
The company provides global factory direct supply ensuring cost efficiency and consistent product standards for diverse poultry farms.
It specializes in poultry farm equipment including automated poultry cage systems, feeders, and drinkers for industrial operations.
It delivers Turn-key engineering solutions covering design, installation, and operational training for Ethiopian poultry farms.
It offers technical support, routine maintenance services, and after-sales consulting to optimize long-term farm performance.
It supports large-scale poultry projects with reliable manufacturing capacity, timely delivery, and customizable cage configurations.
Contact Us To Received Your Customized Poultry Farm Plan
Headquarters And Branchs
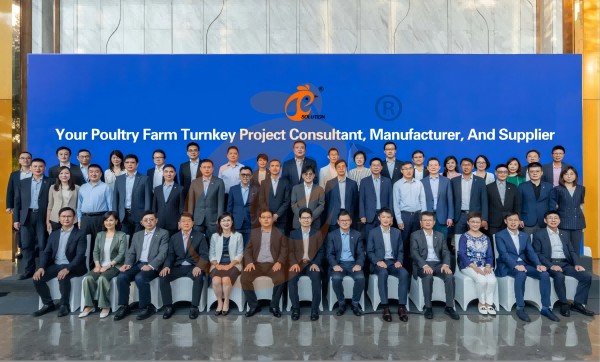
Hong Kong Headquarter Management Team
Hong Kong Headquarter Taiyu Industrial Group CO., LTD
China Hebei Best Machinery And Equipment CO., LTD
Nigeria Vanke Machinery And Equipment CO., LTD
Tanzania Best Machinery And Equipment CO., LTD
Ethiopia Best Hebei Machinery Manufacturing PLC

Reception /24 WhatsApp NO. : +8618830120193
FAQ
How To Implement Biosecurity Measures In H-Type Battery Cage Farm?
Restrict access to outsiders
Isolate sick birds
Mortality rate: 2–3%
Egg production rate: 90-98%
What Is The Average Feed Cost Per Bird In H-Type Layer Cage?
FCR 1.9–2.1
Feed cost: $0.15–0.20 per bird per day
Daily egg yield: 900–980 eggs/1,000 birds
Labor savings: 70-90%
How To Prevent Cannibalism In H-Type Poultry Cage System?
Provide sufficient feed and water
Install anti-pecking devices
Egg production rate: 90-98%
Mortality rate <3%
- poultry farm
- chicken cage
- poultry farms
- poultry cage
- cage
- poultry farm equipment
- poultry farm construction
- poultry cage system
- chicken cage manufacturer
- chicken cage system
- automatic feeding system
- h type chicken cage
- chickencage
- h type cage
- bestchickencage
- cage system
- h type
- cage systems
- Nigeria
- poultry farming
- poultry farming in Ethiopia
- automatic chicken feeding system
- poultry cage systems
- chicken feeding system
- cage manufacturer
- poultry farm plan
- automated poultry cage system
- chicken feed
- Ethiopia
Message
Products recommended
 >30,000 Pullets Automatic H Type Battery Cage1. More than 30,000 pullets a house, choose it.
2. It is designed to rearing older than 1 day old pullets to 12 to 16 weeks old chicken starting laying eggs.
3. Its lifespan is more than 25 years.
4. Its structure are Vcloud artificial intelligent fusion, electric control cabinet, automatic equipment of drinking, feeding, manure clean, manual harvesting.
5. Our 24 hour online reception What’sApp NO. is +8618830120193 <30,000 Pullets Automatic A Type Battery Cage1. 10,000 to 30,000 pullets a house, choose it.
2. It is designed to rearing older than 1 day old pullets to 12 to 16 weeks old chicken starting laying eggs.
3. Its lifespan is more than 25 years.
4. Its structure are Vcloud artificial intelligent fusion, electric control cabinet, automatic equipment of drinking, feeding, manure clean, manual harvesting.
5. Our 24 hour online reception What’sApp NO. is +86 18830120193. >30,000 Broilers Semi-Automatic Harvest H Type Battery Cage1. More than 30,000 broilers a house, choose it.
2. It is designed to rearing 1 to 45 day old adult broiler ready for market.
3. Its lifespan is more than 20 years.
4. Our 24 hour online reception What’sApp NO. is +8618830120193, +234 8111199996. >30,000 Broilers Manual Harvest H Type Battery Cage1. More than 30,000 broilers a house, choose it.
2. It is designed to rearing 1 to 45 day old adult broiler ready for market.
3. Its lifespan is more than 20 years.
4. Its structure are Vcloud artificial intelligent fusion, electric control cabinet, automatic equipment of drinking, feeding and manure clean, manual harvesting.
5. Our 24 hour online reception What’sApp NO. is +8618830120193, +234 8111199996. <30,000 Broilers Manual Harvest A Type Battery Cage1. Less 30,000 broilers a house, choose it.
2. It is designed to rearing 1 to 45 day old adult broiler ready for market.
3. Its lifespan is more than 20 years.
4. Its structure are Vcloud artificial intelligent fusion, electric control cabinet, automatic equipment of drinking, feeding and manure clean, manual harvesting.
5. Our 24 hour online reception What’sApp NO. is +8618830120193, +234 8111199996. HK Headquarter Offers EU-standard Poultry Farm Solutions, Manufacture Poultry Farm Equipment1. Continuous communication with the EU and the US
2. China, Nigeria, Ethiopia, Tanzania branch companies and factories
3. The products’ quality is customized for local poultry farms
4. Poultry cage and poultry farm equipment stock for sale
5. 24 online reception Whatsapp NO. : +8618830120193,contact us to get full information China Branch Offer Poultry Farm Business Plan, Manufacture Poultry Farm Equipment1. Address: Flat/RM 2416, 24/F, Runxing Building, Youyi Nan Street, Shijiazhuang City, Hebei Province, China
2. Poultry cage and poultry farm equipment factory and stock for sale
3. Customized for local poultry farms
4. Quality and design are based on Euro
5. 24 online reception Whatsapp NO. : +8618830120193 Nigeria Branch Offer Poultry Farm Business Plan, Manufacture Poultry Farm Equipment1. Address: After Sinoma Office, 200 Meters Near Danco Filling Station, Lagos/Ibadan Expressway, Lagos State, Nigeria
2. Poultry cage and poultry farm equipment factory and stock for sale
3. Customized for Nigerian poultry farms
4. Quality and design are based on Euro
5. 24 online reception Whatsapp NO. : +8618830120193 Ethiopia Branch Offer Poultry Farm Business Plan, Manufacture Poultry Farm Equipment1. Address: WR93+FQ2, Addis Ababa, Ethiopia
2. Poultry cage and poultry farm equipment stock for sale
3. Customized for Ethiopian poultry farms
4. Quality and design are based on Euro
5. 24 online reception Whatsapp NO. : +8618830120193, contact us to get price list Tanzania Branch Offer Poultry Farm Business Plan, Manufacture Poultry Farm Equipment1. Address: No.8, Sova Road, Msufini, Mlandizi, Kibaha, Pwani, Tanzania
2. Poultry cage and poultry farm equipment factory and stock for sale
3. Customized for Tanzanian poultry farms
4. Quality and design are based on Euro
5. 24 online reception Whatsapp NO. : +8618830120193


Contact
By clicking 'Allow All', you agree to the storage of cookies on your device to enhance site navigation, analyze site usage and assist with our marketing efforts.